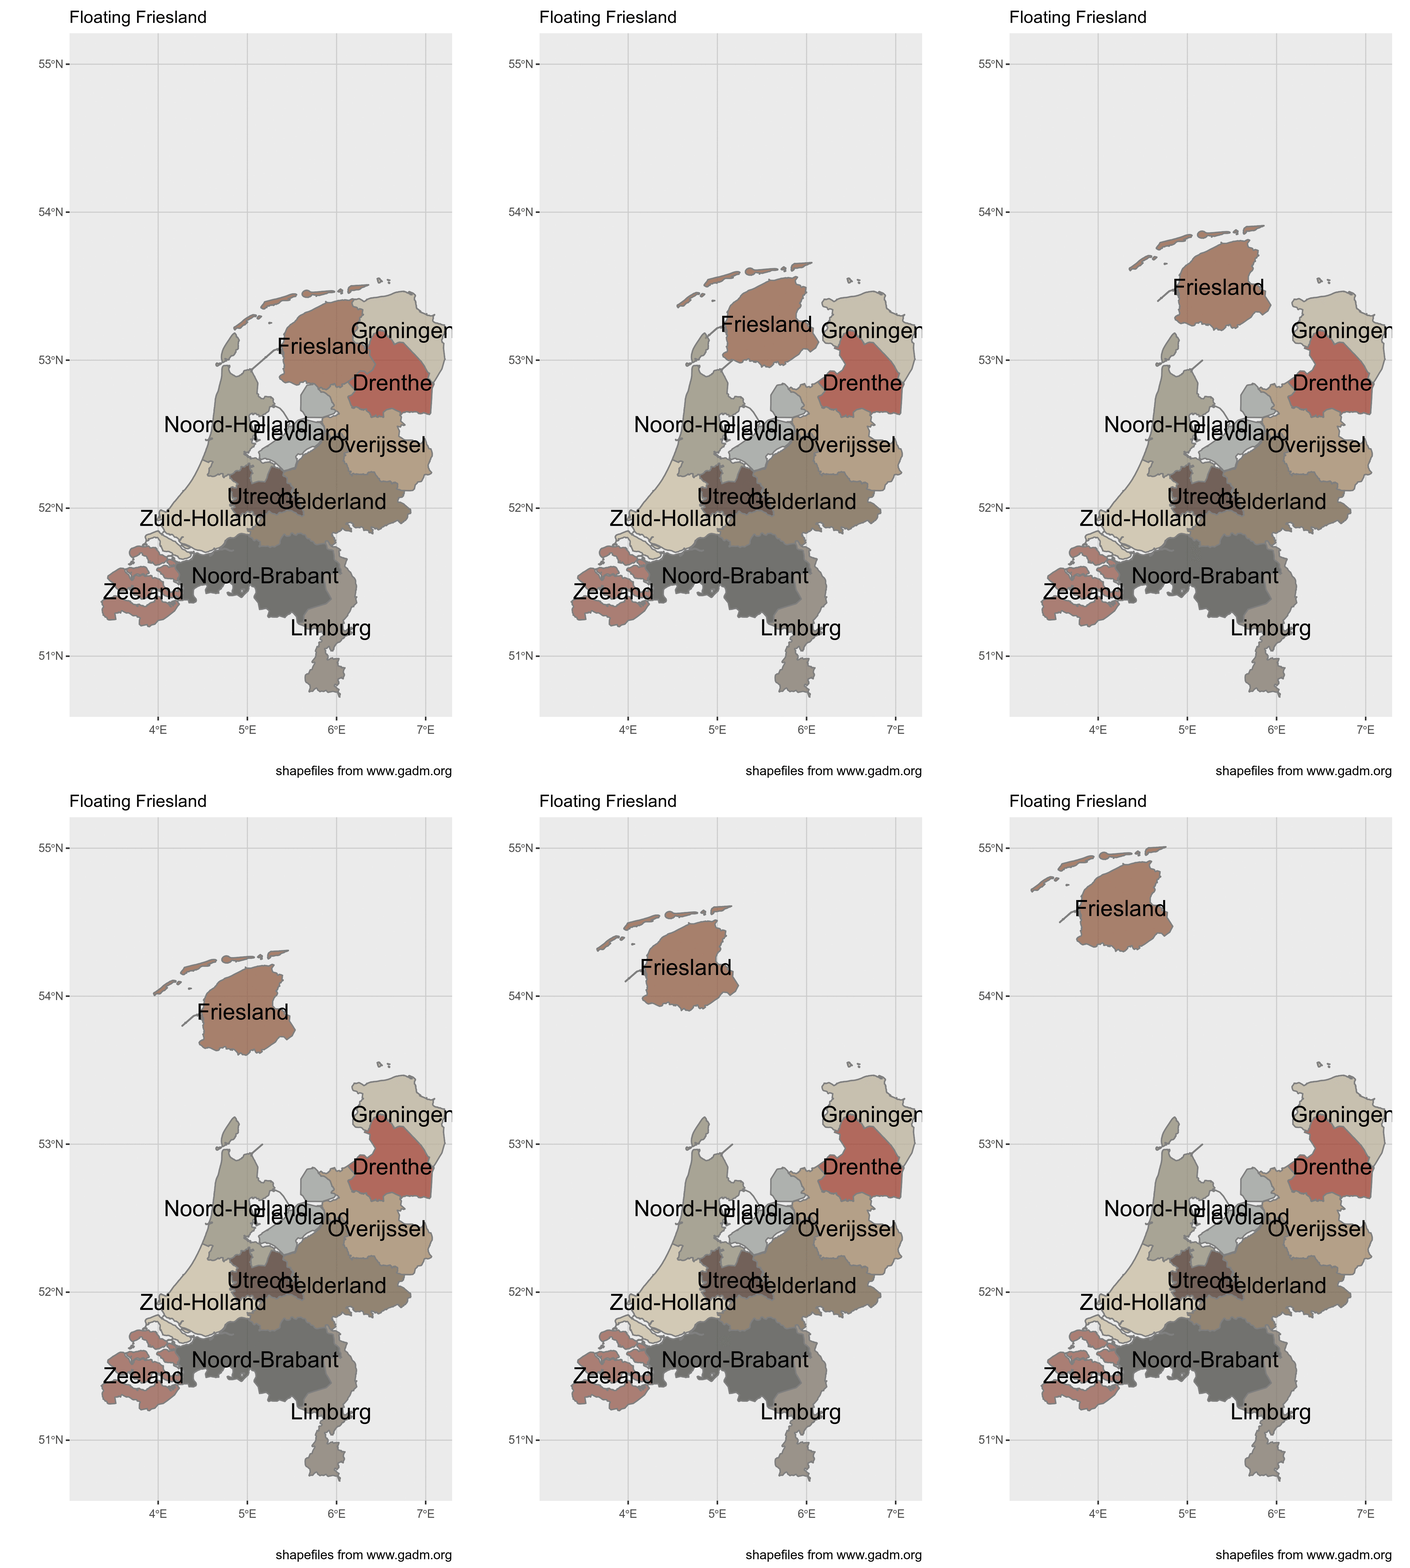
I love making maps, I also love making gifs. In this short post I make an animated gif of parts of a map moving. In this case the parts of the map only move in the xy direction, but you can also turn them, and make them bigger or smaller. Today I show you how I made a part of the Netherlands ‘float away’. It is part of a larger nonsense project (I have many silly projects), and mostly just to document my path to learning about spatial analytics.
End result :

General principles
- make small functions that do one thing well (not that small in this case)
- combine those
- make imagemagick canvas
- write to the canvas
- animate the canvas
loading libraries and data
suppressMessages(library(tidyverse)) # ggplot2, dplyr, purrr, etc.
library(magick)
library(sf)
library(paletti) # thanks @edwinthoen

# colorscheme
dutchmasters_fill <- get_scale_fill(get_pal(dutchmasters))
# the data
NLD <- read_sf("data/NLD_adm1.shp") # I cannot redistribute the data from GADM, but you can download and use it for your projects
basic functions
I created a function that takes a name, uses that to filter the data and apply a transformation on that part only. (a mutate_if() could also work, but I didn’t know how). And also one that uses that function to plot. The final function takes a matrix of xy values and sequentially applies every row to the plotting function.
- modify data
- plot a single ggplot version
- loop or apply over range
# basic function that moves an a province
move_province <- function(provincename, movement){
    mov <- quo(movement)
    rest <- NLD %>%
        filter(NAME_1 != !!provincename) %>%
        filter(TYPE_1 != "Water body")
    #rest %>% st_centroid() %>% st_as_text()
    province <- NLD %>%
        filter(NAME_1 == !!provincename) %>%
        mutate(geometry = geometry + !!mov) %>%
        st_set_crs("+proj=longlat +datum=WGS84 +no_defs")

    data1 <-
        rbind(province, rest)
    centroids <-
        data1 %>% st_centroid()  %>% st_coordinates()
    cbind(data1, centroids)
}
# make function to create plot
# using the previous function to move the province
plot_netherlands <- function(province, movement){
    plotunit <- move_province(provincename = province, movement = movement) %>%
            ggplot()+
            geom_sf(aes(fill = NAME_1),color = "grey50", alpha = 3/4)+
            geom_text(aes(X,Y, label = NAME_1), size = 6)+
            lims(x = c(3.2,7.1), y = c(50.8,55))+
            labs(x="", y = "", caption = "shapefiles from www.gadm.org", title = "Floating Friesland")+
            dutchmasters_fill("little_street")+
            theme( legend.position = "empty", # we already labeled the provinces
                   panel.grid.major = element_line(colour = "grey80"))
    print(plotunit) # you have to explicitly tell it to print so the image is captured
}
# go over every frame and print
plot_province_over_range <-
     function(offset_matrix, province = "Friesland", debug = FALSE){

    if(any(is.na(offset_matrix))){stop("I cannot handle empty movements, there are NA's in movement_matrix")}
    if(NCOL(offset_matrix) != 2) stop("movement_matrix needs to have exactly 2 columns")
    actionsframe <- data_frame(x = offset_matrix[,1], y = offset_matrix[,2]) %>%
        mutate(rownumber = row_number())
    actionsframe$name <- paste0(formatC(actionsframe$rownumber, flag = 0,width = 4))

    pb <- progress_estimated(NROW(actionsframe))

    walk(actionsframe$name, ~{

        pb$tick()$print()
        vars <- filter(actionsframe, name == .x)
        if(debug){
            message("using values from: ",vars)
        }

        plot_netherlands(province = province,movement = c(vars$x[[1]], vars$y[[1]]))

        }) # ends the walk action
}
The plotting and saving
Nothing happened before the next step (except loading data). All the action and calculation happens here.
## then the creation starts with the movement
Friesland_moves <- rbind(
    matrix(c(c(0,-.1,-.2,-.2,-.3), c(0,.03,.05,.1,.15)) ,ncol = 2),
    matrix(c(seq(from = -.3, by = -.1, length.out = 14),seq(from = .2, by = .1, length.out = 14)), ncol = 2)
)
# set up print location
frames <- image_graph(width = 1500, height = 2500, res = 300, pointsize = 5)


plot_province_over_range(offset_matrix = Friesland_moves, province = "Friesland")

# animate
image_animate(frames, 1) %>%
    image_write(path = "friesland.gif")
Notes
- code for gif 2 imagemagick
- larger githubproject - floating friesland
- stackoverflow answer that helped me make the gif
- palleti package: making your own color pallete
I tried to edit this post on github on my mobile phone, boy, that does not work at all!