If you believe some people, everything is getting worse1. More so in infosec. For the past few years I listened to many many hours of podcasts, many hours where spent on the weekly show Security Now!. The hosts Steven Gibson and Leo Laporte have been talking about security related news every week over 13 years. Although the content has changed over time, there used to be more explanations but the majority of time is now filled with news, we could use the sentiment in the episodes to see if ‘everything is getting worse’. Has the sentiment of the security now! podcast changed over time? It helps that every episode is transcribed into text so we can use natural language processing tools to work through this problem.
Extracting the data
To gather and extract the relevant information from the transcripts I point you kindly to a seperate github page where I explain how I downloaded every episode and extracted the structure. https://github.com/RMHogervorst/NLP_SN
I asked permission to scrape all the transcripts but I’m not entirely sure if I can share the content. In any case I’d guide you to the links at the bottom of this page with all the archive. I might share the rda file with the episode information and transcripts into 1 dataframe.
What I ended up with is a dataframe with 664 rows (the number of episodes today) and 9 columns.
library(tidytext)
library(tidyverse)
## ── Attaching packages ───────────────────────────────────────────────────────────────────────────────────────────────── tidyverse 1.2.1 ──## ✔ ggplot2 2.2.1.9000 ✔ purrr 0.2.5
## ✔ tibble 1.4.2 ✔ dplyr 0.7.5
## ✔ tidyr 0.8.1 ✔ stringr 1.3.1
## ✔ readr 1.1.1 ✔ forcats 0.3.0## ── Conflicts ──────────────────────────────────────────────────────────────────────────────────────────────────── tidyverse_conflicts() ──
## ✖ dplyr::filter() masks stats::filter()
## ✖ dplyr::lag() masks stats::lag()library(widyr)
if(!file.exists("df_sn.RDS")){
download.file(
url = "https://github.com/RMHogervorst/NLP_SN/raw/master/df_sn.RDS",
destfile = "df_sn.RDS",cacheOK = TRUE)
}
df_sn <- read_rds("df_sn.RDS")
#df_sn <- read_rds("../NLP_SN/df_sn.RDS") # when working locally
#
# Every week / or once a month at least I will update the file with new transcript(s) so your data could be newer than this post.
#dim_desc(df_sn)
tail(df_sn,2)## # A tibble: 2 x 9
## path source date description ep_nr hosts teaser title text
## <chr> <chr> <chr> <chr> <int> <lis> <chr> <chr> <lis>
## 1 data//sn-663.txt https… May … This week … 663 <lis… It's … Ultr… <tib…
## 2 data//sn-664.txt https… May … This week … 664 <lis… It's … Spec… <tib…The text column contains a tibble with a row for everytime anyone speaks untill the other takes over. The length
df_sn[664,9][[1]][[1]]## # A tibble: 139 x 3
## linenr text speaker
## <int> <chr> <chr>
## 1 1 This is Security Now! with Steve Gibson, Episode 664, r… LEO
## 2 2 Yay, Leo, great to be with you again, as always. STEVE
## 3 3 Always a pleasure. LEO
## 4 4 Yeah, we scrambled here a little bit at the end because… STEVE
## 5 5 [Crosstalk] half an hour ago. No, but I also figured y… LEO
## 6 6 "Well, yeah. Two weeks ago the news leaked through Hei… STEVE
## 7 7 They were presumably waiting to disclose until companie… LEO
## 8 8 Yes. And even so, I mean, this is - what we heard was … STEVE
## 9 9 Right. LEO
## 10 10 I can't square that with the news of two because all we… STEVE
## # ... with 129 more rowsSteve talks a lot more then Leo, and we see that in the number of words per line of a single episode:
df_sn[664,9][[1]][[1]] %>%
    mutate(
        nr_char = str_length(text),
        N_words = str_count(text, "\\w+")
        ) %>%
    ggplot(aes(linenr, N_words, fill = speaker))+
    geom_col()+
    labs(
        title = "Number of words in every line in episode 664",
        subtitle = "Steve talks a lot more than Leo (not surprising)",
        x = "line number", y = "Number of words (log2 scale)",
        caption = "Transcripts Security Now! - 664"
    )+
    scale_y_continuous(trans = "log2")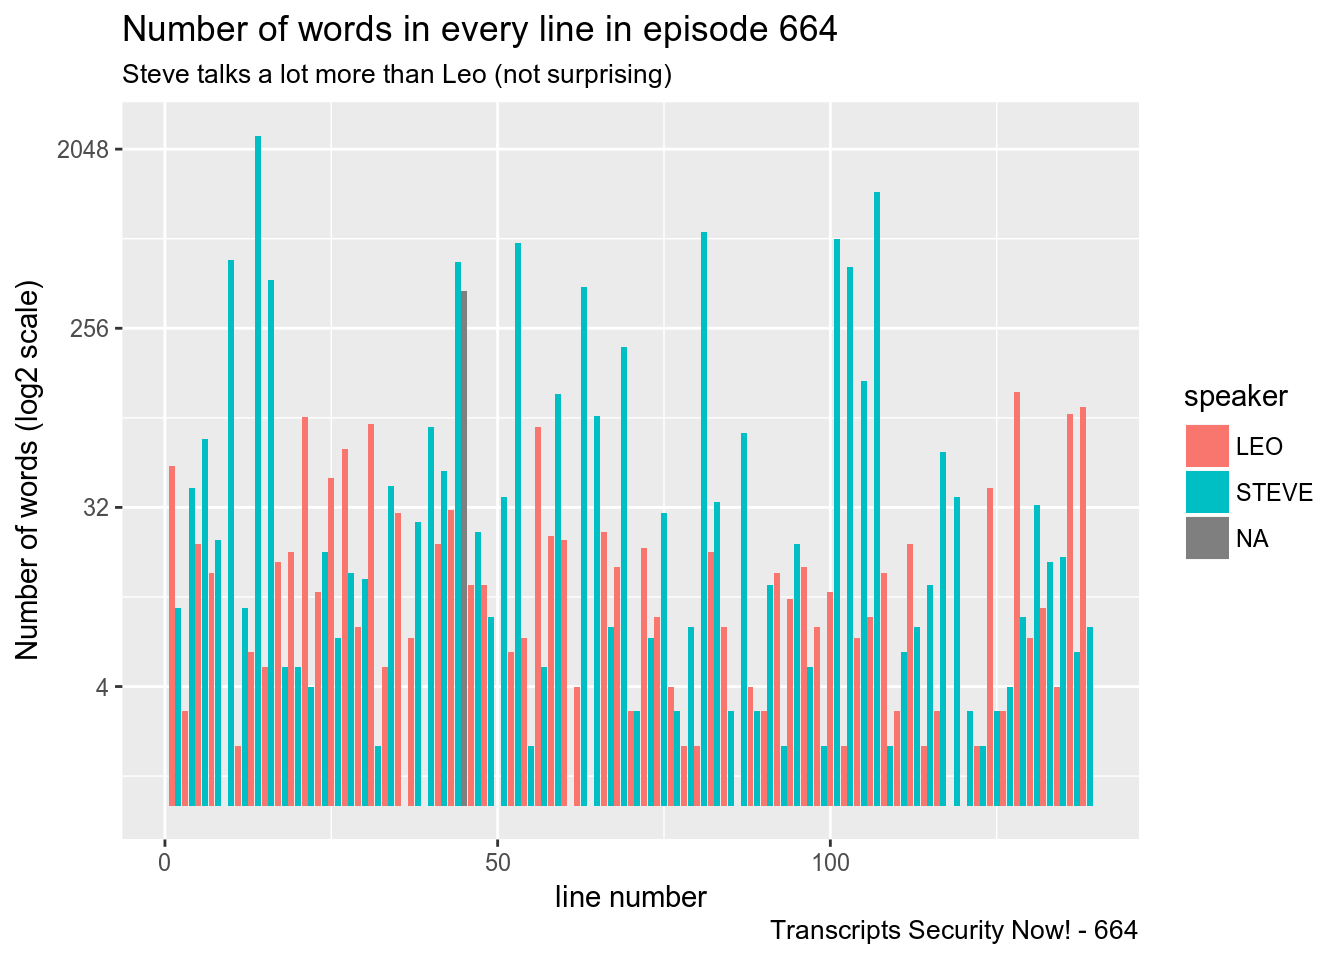
Interestingly my scraper seems to not have detected who said the words on line 45. It was Steve.
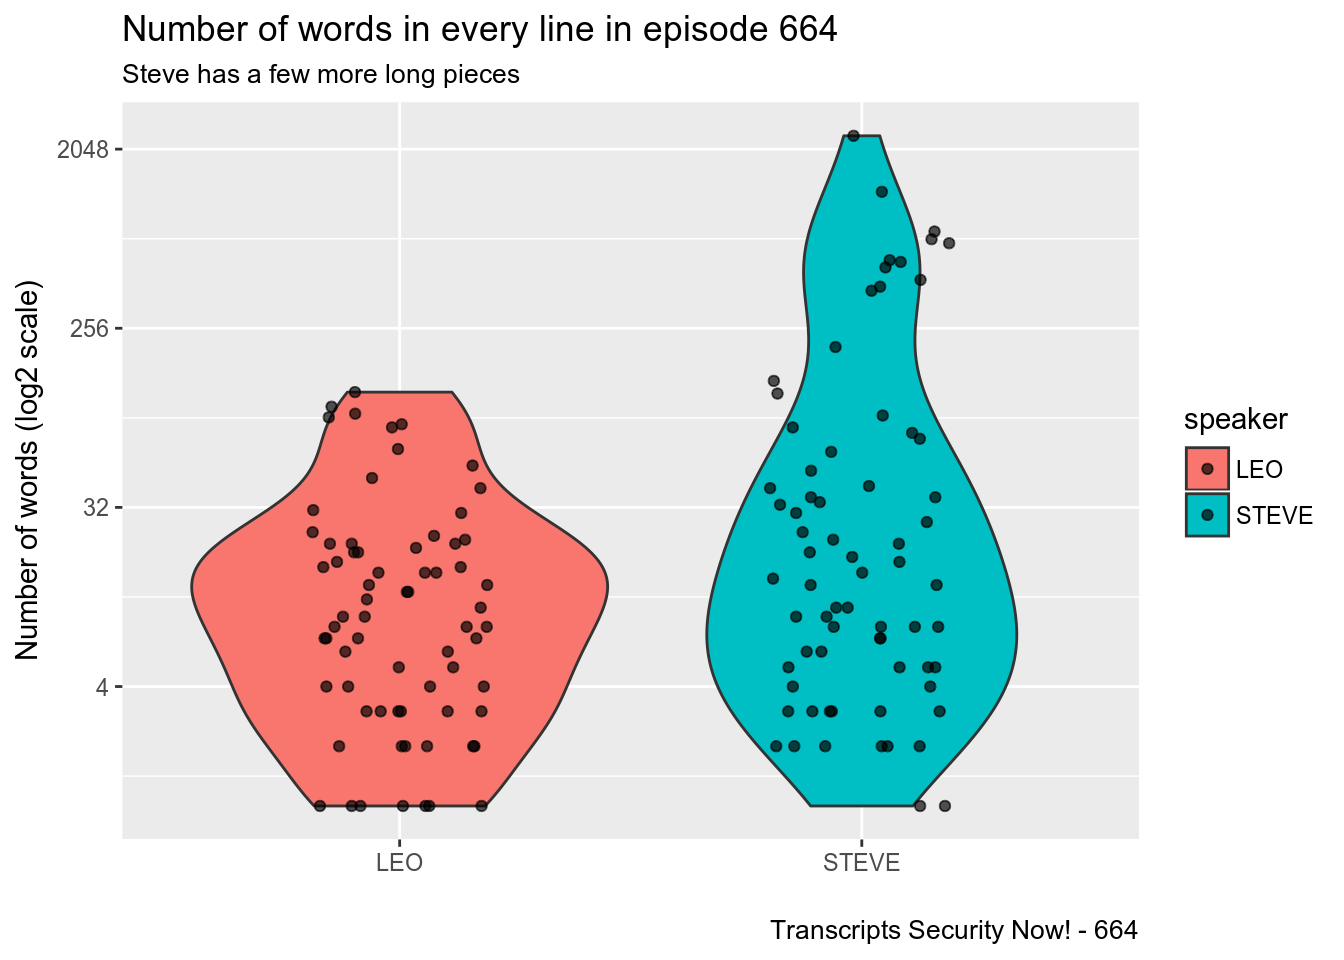
It might be better to use an average over the episode
df_sn[664,9][[1]][[1]] %>%
    mutate(
        N_words = str_count(text, "\\w+"),
        speaker = ifelse(is.na(speaker), "STEVE", speaker)
        ) %>%
    ggplot(aes(speaker, N_words, fill = speaker))+
    geom_violin()+
    geom_jitter(height = 0,width = .2, alpha  = 2/3)+
    scale_y_continuous(trans = "log2")+
    labs(
        title = "Number of words in every line in episode 664",
        subtitle = "Steve has a few more long pieces",
        x = "", y = "Number of words (log2 scale)",
        caption = "Transcripts Security Now! - 664"
    )
Links
State of the machine
At the moment of creation (when I knitted this document ) this was the state of my machine:
sessioninfo::session_info()## ─ Session info ──────────────────────────────────────────────────────────
## setting value
## version R version 3.4.4 (2018-03-15)
## os Ubuntu 18.04 LTS
## system x86_64, linux-gnu
## ui X11
## language (EN)
## collate en_US.UTF-8
## tz Europe/Amsterdam
## date 2018-06-01
##
## ─ Packages ──────────────────────────────────────────────────────────────
## package * version date source
## assertthat 0.2.0 2017-04-11 CRAN (R 3.4.3)
## backports 1.1.2 2017-12-13 CRAN (R 3.4.3)
## bindr 0.1.1 2018-03-13 CRAN (R 3.4.4)
## bindrcpp * 0.2.2 2018-03-29 CRAN (R 3.4.4)
## blogdown 0.6 2018-04-18 CRAN (R 3.4.4)
## bookdown 0.7 2018-02-18 CRAN (R 3.4.3)
## broom 0.4.4 2018-03-29 CRAN (R 3.4.4)
## cellranger 1.1.0 2016-07-27 CRAN (R 3.4.3)
## cli 1.0.0 2017-11-05 CRAN (R 3.4.3)
## clisymbols 1.2.0 2017-05-21 cran (@1.2.0)
## colorspace 1.3-2 2016-12-14 CRAN (R 3.4.3)
## crayon 1.3.4 2017-09-16 CRAN (R 3.4.3)
## digest 0.6.15 2018-01-28 CRAN (R 3.4.3)
## dplyr * 0.7.5 2018-05-19 cran (@0.7.5)
## evaluate 0.10.1 2017-06-24 CRAN (R 3.4.3)
## forcats * 0.3.0 2018-02-19 CRAN (R 3.4.3)
## foreign 0.8-69 2017-06-21 CRAN (R 3.4.2)
## ggplot2 * 2.2.1.9000 2018-02-22 Github (tidyverse/ggplot2@39e4a3b)
## glue 1.2.0.9000 2018-05-21 Github (tidyverse/glue@7230ed2)
## gtable 0.2.0 2016-02-26 CRAN (R 3.4.3)
## haven 1.1.1 2018-01-18 CRAN (R 3.4.3)
## hms 0.4.2 2018-03-10 CRAN (R 3.4.4)
## htmltools 0.3.6 2017-04-28 CRAN (R 3.4.3)
## httr 1.3.1 2017-08-20 CRAN (R 3.4.3)
## janeaustenr 0.1.5 2017-06-10 CRAN (R 3.4.3)
## jsonlite 1.5 2017-06-01 CRAN (R 3.4.3)
## knitr 1.20 2018-02-20 CRAN (R 3.4.3)
## labeling 0.3 2014-08-23 CRAN (R 3.4.3)
## lattice 0.20-35 2017-03-25 CRAN (R 3.4.2)
## lazyeval 0.2.1 2017-10-29 CRAN (R 3.4.3)
## lubridate 1.7.4 2018-04-11 CRAN (R 3.4.4)
## magrittr 1.5 2014-11-22 CRAN (R 3.4.3)
## Matrix 1.2-14 2018-04-09 CRAN (R 3.4.4)
## mnormt 1.5-5 2016-10-15 CRAN (R 3.4.3)
## modelr 0.1.2 2018-05-11 CRAN (R 3.4.4)
## munsell 0.4.3 2016-02-13 CRAN (R 3.4.3)
## nlme 3.1-137 2018-04-07 CRAN (R 3.4.4)
## pillar 1.2.2 2018-04-26 CRAN (R 3.4.4)
## pkgconfig 2.0.1 2017-03-21 CRAN (R 3.4.3)
## plyr 1.8.4 2016-06-08 CRAN (R 3.4.3)
## psych 1.8.4 2018-05-06 CRAN (R 3.4.4)
## purrr * 0.2.5 2018-05-29 cran (@0.2.5)
## R6 2.2.2 2017-06-17 CRAN (R 3.4.3)
## Rcpp 0.12.17 2018-05-18 cran (@0.12.17)
## readr * 1.1.1 2017-05-16 CRAN (R 3.4.3)
## readxl 1.1.0 2018-04-20 CRAN (R 3.4.4)
## reshape2 1.4.3 2017-12-11 CRAN (R 3.4.3)
## rlang 0.2.0.9001 2018-05-31 Github (tidyverse/rlang@4e7e8f7)
## rmarkdown 1.9 2018-03-01 CRAN (R 3.4.3)
## rprojroot 1.3-2 2018-01-03 CRAN (R 3.4.3)
## rstudioapi 0.7 2017-09-07 CRAN (R 3.4.3)
## rvest 0.3.2 2016-06-17 CRAN (R 3.4.3)
## scales 0.5.0.9000 2018-05-03 Github (hadley/scales@d767915)
## sessioninfo 1.0.0 2017-06-21 cran (@1.0.0)
## SnowballC 0.5.1 2014-08-09 CRAN (R 3.4.3)
## stringi 1.2.2 2018-05-02 CRAN (R 3.4.4)
## stringr * 1.3.1 2018-05-10 CRAN (R 3.4.4)
## tibble * 1.4.2 2018-01-22 CRAN (R 3.4.3)
## tidyr * 0.8.1 2018-05-18 CRAN (R 3.4.4)
## tidyselect 0.2.4 2018-02-26 CRAN (R 3.4.3)
## tidytext * 0.1.8 2018-03-21 CRAN (R 3.4.4)
## tidyverse * 1.2.1 2017-11-14 CRAN (R 3.4.3)
## tokenizers 0.2.1 2018-03-29 CRAN (R 3.4.4)
## utf8 1.1.4 2018-05-24 CRAN (R 3.4.4)
## widyr * 0.1.1 2018-03-11 CRAN (R 3.4.4)
## withr 2.1.2 2018-03-15 CRAN (R 3.4.4)
## xfun 0.1 2018-01-22 CRAN (R 3.4.3)
## xml2 1.2.0 2018-01-24 CRAN (R 3.4.3)
## yaml 2.1.19 2018-05-01 cran (@2.1.19)Not if we learn from Hans Rosling but that is a story for an other time↩